Get in touch with PCBark Company


By GW | Last updated: November 2026 (Updated November 2026)
An eye diagram is an oscilloscope persistence display that overlays waveform segments aligned to symbol periods, or unit intervals; NRZ encodes one bit per UI, while PAM4 encodes two bits per unit interval. Vertical eye height corresponds to voltage noise margin in millivolts, and horizontal eye width corresponds to timing margin in picoseconds, against jitter.
In the world of electronics, an eye diagram examines serial communication channels rather than human anatomy, while its waveform shape resembles a part of the eye. According to Signal Integrity Journal’s PCIe 7.0 CEM channel validation study, PCI Express links have increased speed from 2.5 GT/s in earlier generations to 64 GT/s in PCIe 6.0 and 128 GT/s in PCIe 7.0. In the same regard, a symbol unit interval has decreased from 400 ps to 15.625 ps. With these increased speeds, skin effect and dielectric loss in the copper traces cause signal distortion and unwanted reflections that can close the unequalized eye before it reaches the receiver latch.
Quick Engineering Reference: High-Speed PCB Eye Metrics
- A symbol period, or Unit Interval (UI), is 1,000 divided by the symbol rate in GBaud. NRZ encodes one bit per UI (100 ps at 10 Gbps; 31.25 ps at 32 GT/s). PAM4 encodes two bits per UI (15.625 ps at 64 GBaud).
- Logic 1 and Logic 0 are samples of voltage levels across the central 40% to 60% of the horizontal unit interval, according to Sierra Circuits’ high-speed PCB eye diagram guide.
- Signal transition slew rates are measured between the 10% and 90%, 20% and 80%, or 30% and 70% voltage thresholds.
- Dual-Dirac Total Jitter at 10-12 BER, follows TJ = DJ + 14.069 × RJrms for NRZ links (Q = 7.0345). Total Jitter of 0.5 UI leaves 0.5 UI of horizontal eye width before receiver sampling setup and hold requirements.
- In four-level PAM4 signaling at equal swing, adjacent level spacing is reduced to one-third of NRZ. The reduction creates a 9.54 dB SNR penalty.
- Shorten unused via stubs by backdrilling to increase their quarter-wave resonant frequency. Set controlled-impedance tolerances on high-speed channels (to ±5% on critical pairs tested on TDR coupons).
What Is an Eye Diagram in High-Speed Electronics?
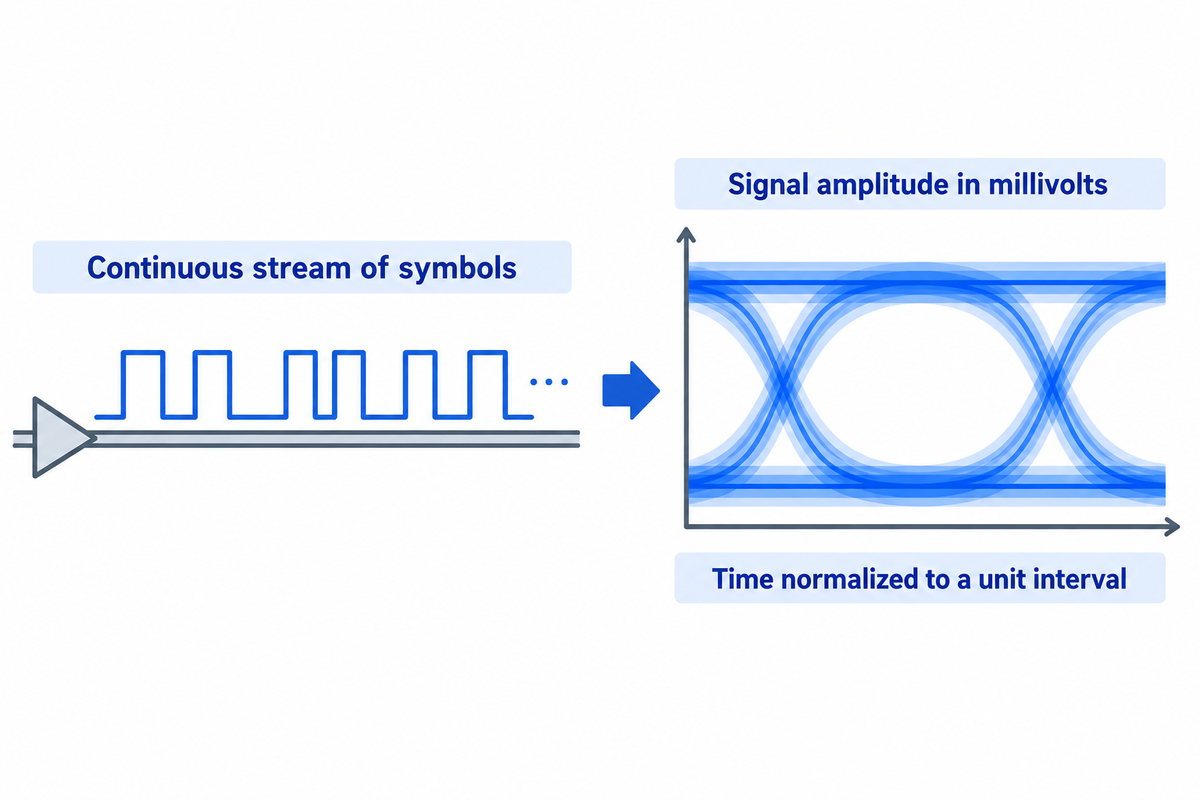
On high-speed channels, an eye diagram is a statistical persistence image created on an oscilloscope that overlays consecutive unit-interval segments onto a composite window to reveal amplitude attenuation, inter-symbol interference, and timing jitter across millions of captured symbol periods during link verification.
Every serial link transmits a continuous stream of symbols across a PCB trace or cable. In Compliance Magazine’s technical guide to eye diagrams illustrates this folding process using all eight 3-bit sequences (000 through 111). Superimposing those eight bit patterns onto a single time window folds rising edges, falling edges, and steady rails into one composite graph. The vertical axis is signal amplitude in millivolts (mV). The horizontal axis represents time normalized to a unit interval.
The duration of one unit interval equals the reciprocal of the symbol rate. In binary Non-Return-to-Zero (NRZ) signaling, one symbol represents one bit period. A 10 Gbps NRZ stream has a 100 ps UI. A 25 Gbps Ethernet lane narrows that window to 40 ps. At 32 GT/s in PCIe 5.0, one UI lasts 31.25 ps. Signal Integrity Journal’s PCIe 7.0 CEM channel validation study tracks this progression across generations. PCI Express bandwidth scaled from 2.5 GT/s in the early 2000s to 64 GT/s in PCIe 6.0 and 128 GT/s (64 GBaud PAM4, 15.625 ps UI) in PCIe 7.0.
3 bits8 sequences folded per UI
64 GT/sPCIe 6.0 PAM4 data rate
128 GT/sPCIe 7.0 PAM4 data rate
A single-shot waveform capture shows a short duration of time and only captures a few dozen bits. Rare transition errors are hidden in these waveform captures. Color-graded persistence, a diagnostic tool, can display millions of transitions and generates a two-dimensional density histogram. Rare signal trajectories across transitions are shown in cold blue and green pixels. Warm red and yellow pixels indicate where the data signal spends most of its time in this illustration. Engineers use this display to verify digital audio, uncompressed video links, and multi-gigabit server backplanes. An open central region of a display indicates margin in timing and voltage for samples displayed, and rare jitter and noise may require a statistical tail analysis.
How to Read Eye Height, Eye Width, and Crossing Percentage
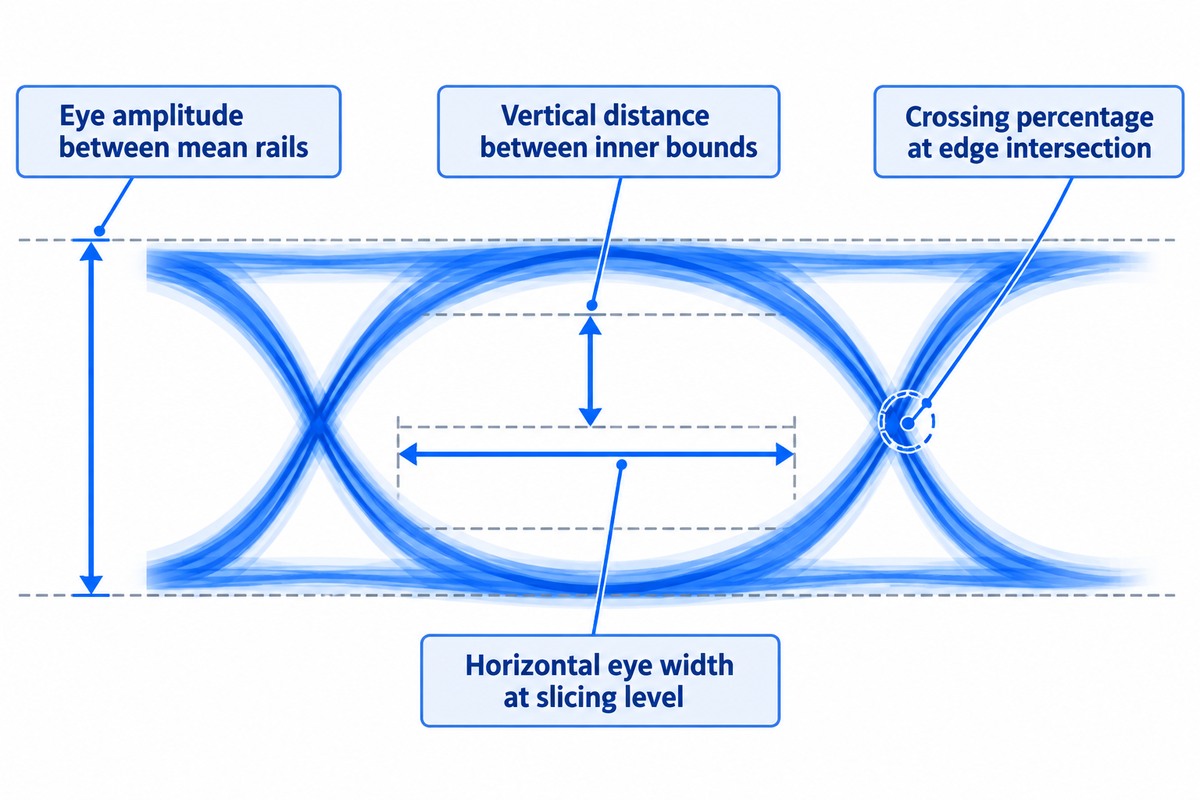
You read an eye diagram by measuring six core geometry metrics on the display. These metrics are, logic 1 and logic 0 voltage rails, eye amplitude, vertical eye height, horizontal eye width, crossing percentage, and edge rise and fall times. All six of these readouts define the opening and quantify link performance under load.
Engineers often confuse eye amplitude with eye height. Eye amplitude is the difference between the mean logic 1 voltage (V1,mean) and the mean logic 0 voltage (V0,mean). Per Sierra Circuits’ high-speed PCB eye diagram guide, oscilloscopes sample both rail means across the central 40% to 60% of the horizontal time axis. Eye height is the vertical distance between inner rail boundaries. A 3-sigma histogram readout uses fixed statistical bounds, while BER-based eye height uses inner contours calculated for the specified error probability. In Compliance Magazine’s waveform measurement breakdown illustrates how vertical histograms define these rail boundaries.
Using 3-sigma oscilloscope vertical histogram bounds, the instrument calculates:
Eye Amplitude = V1_mean – V0_mean;
Eye Height (3-sigma) = (V1_mean – 3 × sigma_1) – (V0_mean + 3 × sigma_0);
Crossing Percentage = 100 × (V_cross – V0_mean) / (V1_mean – V0_mean).
Horizontal eye width measures the clear time window between the rising and falling crossing histograms at the slicing level. Crossing percentage locates where the rising and falling edges intersect relative to the logic rails. A crossing point away from the mid-rail level indicates vertical crossing asymmetry. That shift can arise from unequal rise and fall slew rates or duty-cycle distortion (DCD), where high and low pulse widths are unequal. Sierra Circuits’ signal transition analysis notes that rise and fall times are measured between the 10% and 90% thresholds. Engineers also use 20% and 80% or 30% and 70% thresholds to avoid pre-shoot artifacts. Maintaining clean edge symmetry on dense multilayer boards requires balanced stackups, as detailed in our 8-12 layer PCB stackup and impedance control guide.
| Eye Parameter | Measurement Axis & Window | Engineering Definition | What Degradation Indicates |
|---|---|---|---|
| Eye Amplitude | Vertical mean across 40%–60% UI (Sierra Circuits) | Difference between mean logic 1 and mean logic 0 levels | Excessive DC series resistance or transmitter swing droop |
| Eye Height | Vertical inner opening at optimal sampling instant | Inner vertical opening between rail noise distributions | Dielectric insertion loss, ISI, crosstalk, or reflections |
| Eye Width | Horizontal inner opening at decision threshold | Unit interval minus Total Jitter (1 UI – TJ) at target BER | Random phase noise, DDJ, or intra-pair P/N delay skew |
| Crossing Percentage | Vertical intersection of rising and falling edges | Ratio of crossing level to eye amplitude relative to mid-rail | Duty-cycle distortion (DCD) or asymmetric rise/fall slew |
| Rise / Fall Time | 10%–90%, 20%–80%, or 30%–70% thresholds (Sierra Circuits) | Transition duration between lower and upper voltage thresholds | High-frequency channel roll-off or capacitive pad loading |
How Jitter Narrows Eye Width: TJ, RJ, DJ, and DCD Explained
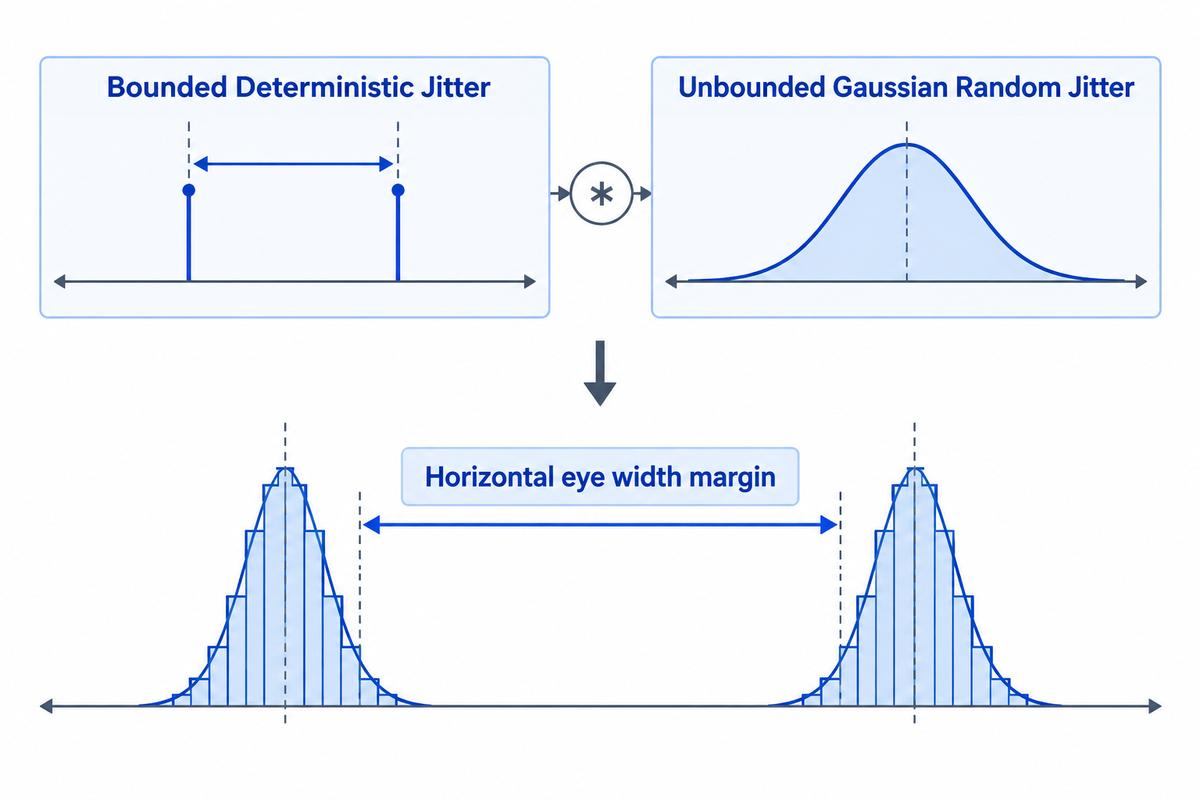
Jitter narrows the horizontal eye width by shifting signal zero-crossings earlier or later than the ideal recovered clock instant. Unbounded Gaussian Random Jitter (RJ) increases with observation depth, whereas Deterministic Jitter (DJ) is bounded. In order to calculate Total Jitter (TJ) at the target bit error rate, engineers have to separate RJ from DJ.
As stated in Sierra Circuits’ timing margin evaluation, timing margin rapidly diminishes as total jitter approaches 0.5 UI. In the Dual-Dirac jitter model, total jitter of 0.5 UI results in a horizontal eye width of 0.5 UI at the target BER before accounting for receiver sampling window requirements. Total jitter is made up of two components:
- Random Jitter (RJ) is modeled by a zero-mean, unbounded, Gaussian timing noise, and is caused by thermal noise, shot noise and flicker noise in the oscillators and reference clocks. Gaussian tails extend to positive and negative infinity and therefore peak-to-peak RJ scales with the target BER.
- Deterministic Jitter (DJ) consists of bounded timing deviations with a physical cause. DJ is made up of Data-dependent Jitter (DDJ, caused by inter-symbol interference across varying bit pattern runs), Duty-cycle distortion (DCD), and other types of jitter.
The tail multipliers used by the Dual-Dirac model are derived from NIST Gaussian normal probability tail functions. Using the above, Total Jitter at a given BER is:
TJ(BER) = DJ_delta_delta + 2 × Q(BER) × sigma_RJ; Eye Width(BER) = 1 UI – TJ(BER)
For a binary NRZ link requiring 10 -12 BER, the Gaussian tail factor is Q = 7.0345, so 2 × Q = 14.069. Therefore, 2 × Q = 14.069. Let’s look at a sample problem for a 25 Gbps NRZ link (1 UI = 40 ps). Assumed inputs: We’ll assume DJ dd = 8.0 ps and sigma RJ = 1.5 ps. We multiply 14.069 by 1.5 ps to get 21.1 ps random jitter. We add 8.0 ps of DJ to get total jitter (TJ) for 10-12 BER = 29.1 ps. This leaves an open horizontal eye width = 40 ps – 29.1 ps = 10.9 ps (0.27 UI). A short 1,000-bit oscilloscope capture may miss Gaussian tail excursions and overestimate horizontal eye margin. Vertical eye height may provide cleaner voltage margin. Measured p-p jitter of an eye only describes captured samples and doesn’t describe total jitter at the target BER.
In PAM4 links, jitter analysis is even more strict. Signal Integrity Journal’s PAM4 validation analysis notes that in PAM4 links, jitter evaluation can’t depend on just 2 NRZ transition edges with respect to the recovered clock, as is the case in binary NRZ links. Instead, it must analyze 12 directed transitions across all four symbol states. That 12-edge analysis captures level-dependent skew and voltage non-linearity.
Why does an eye diagram with a thin single rail perform better than one with a thick fuzzy rail?
A thin single rail on an oscilloscope eye diagram visual representation (or eye pattern) indicates tightly repeatable logic voltage levels across all high-speed digital signal bit transitions. That repeatability maximizes vertical noise margin. A thick fuzzy single rail indicates amplitude dispersion, probably from thermal noise, uncompensated ISI, and/or crosstalk.
From Oscilloscope Eye Opening to 10^-12 BER Contours and Bathtub Curves
Contouring BER curves helps translate finite eye captures into statistical bit error rate (BER) predictions down to 10-12 or 10-15. These contours connect points of equal error probability across voltage and time. The bathtub curve is a horizontal slice through the center of the ber contours.
Real-time oscilloscope persistence overlays thousands to millions of unit intervals and directly observes only the 10-3 to 10-6 probability region. Proving 10-12 BER margin therefore requires Gaussian random-jitter tail extrapolation or statistical eye convolution. By binomial confidence math (1 – 0.051/N ≈ 3/N), observing zero errors in 106 captured bits bounds the error probability to roughly 3 × 10⁻⁶. MDPI Electronics’ statistical eye diagram research shows why brute-force transient simulation can’t bridge that gap. Time-domain transient simulation must sample 50, 64, or 100 points per unit interval. Running 1012 bits in transient mode would exhaust workstation memory. Statistical eye simulators solve this by convolving the channel single-bit pulse response with transition probabilities. They also account for line encodings like 8B/10B or TMDS where transition probability shifts above or below 0.5.
In PCIe 6.0 and PCIe 7.0 PAM4 links, raw physical channels don’t hit 10-12 BER directly at the slicer. PCI-SIG’s PCIe 6.0 FEC and FLIT error-correction specification overview explains this multi-layer architecture. The equalized receiver targets a pre-FEC First Bit Error Rate (FBER) strictly below 10-6. Lightweight 3-way interleaved Forward Error Correction (FEC) across fixed 256-byte FLITs then works with CRC detection and link-level FLIT retry to reach 10-12 link reliability.
How does eye diagram mask testing verify protocol compliance?
Eye-mask testing examines sampled data to see if any waveform enters a predefined keep-out region. (Sierra Circuits) Six points along an inner limit combine with outer limit voltage levels to define the keep out region. Full protocol compliance mandates that mask testing be performed along with jitter, return loss, and an equalized receiver BER test.
6 Eye Diagram Distortion Patterns and What Causes Them
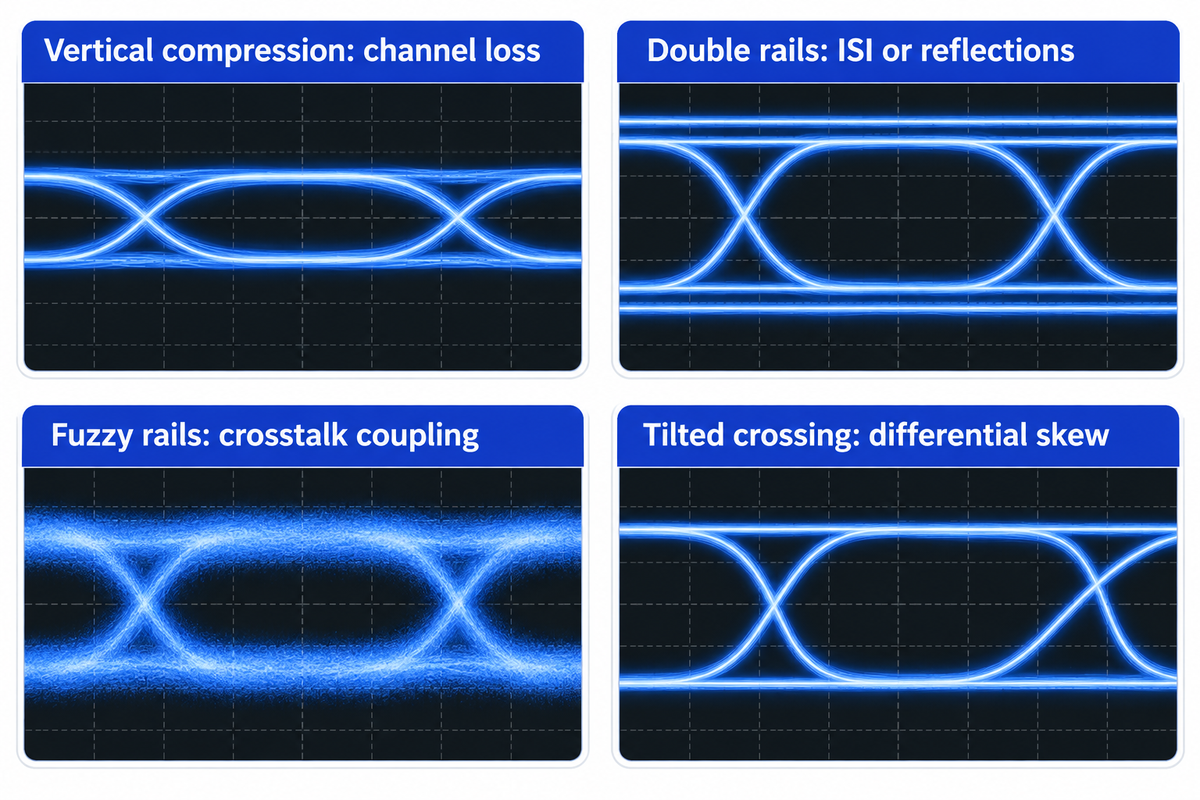
Eye-diagram distortion shapes identify possible physical layer issues on the board. Vertical compression points to channel loss, double rails point to ISI, reflections, or over-equalization, fuzzy rails indicate crosstalk, and a tilted crossing indicates differential skew.
Increasing voltage swing when an eye closes in the channel worsens near-end crosstalk and wastes power. In channels from PCIe 3.0 onward, each end of the channel (transmitter and receiver) is equalized to help recover an eye closed by channel ISI. A closed, unequalized passive eye, therefore, doesn’t necessarily indicate channel failure. For PCIe 6.0 and 7.0 PAM4 channels, Signal Integrity Journal’s CEM channel compliance study states that a clear pass/fail benchmark is provided. The reference receiver must be equalized in such a way that it hits a pre-FEC FBER target of 10-6 in order to meet the 10-12 BER target.
One of the most harmful board defects is an unused through-hole via barrel acting as an open-ended quarter-wave stub. Its first insertion-loss resonance occurs at:
f_res = c / (4 × L_stub × sqrt(Dk_eff)).
Assumed inputs: effective dielectric constant Dkeff = 4.0 and speed of light c = 11.8 in/ns. On a thick backplane, a 120 mil (0.120 in) via stub resonates at 12.3 GHz. That places a deep attenuation notch at 25-28 Gbps NRZ signals. On a standard multilayer board, a 60 to 80 mil stub resonates between 18.4 GHz and 24.6 GHz. That notch distorts 32 GT/s PCIe 5.0 and 64 GT/s PCIe 6.0 channels, as studied in via-stub resonance studies in IEEE Xplore. To verify channel loss on production panels, IPC-TM-650 Method 2.5.5.12A defines five insertion-loss test methods, including Single-Ended TDR to Differential Insertion Loss (SET2DIL, Method D) and frequency-domain VNA S-parameters (Method E). SET2DIL captures total coupon insertion loss including via transitions. The total loss combines electrical conductor and dielectric loss mechanisms.
6-Signature Eye Closure Diagnostic Map
This diagnostic matrix links six oscilloscope eye distortions (with sub-cases for ISI vs. Over-Equalization and NEXT vs. FEXT) to their electronic mechanisms and root causes on PCBs and lab tests that confirm them.
| Visual Eye Signature | Primary Electrical Impairment | PCB Layout / Channel Root Cause | Confirming Lab Test & Engineering Fix |
|---|---|---|---|
| 1. Rounded edges & vertical compression | High-frequency dielectric & skin-effect insertion loss (Sdd21) | Long trace routing on high-Df FR-4 or rough ED copper foil | VNA Sdd21 or SET2DIL coupon. Switch to low-Df laminate and HVLP copper or apply Rx CTLE peaking. |
| 2A. Split / double rails (inner rail lower) | Post-cursor inter-symbol interference (ISI / DDJ) | Isolated 010 bits fail to reach full rail voltage compared to 01110 runs | Compare PRBS7 vs. PRBS31 eye. Tune Tx FFE de-emphasis and Rx DFE post-cursor tap weights. |
| 2B. Split / double rails (transition overshoot) | Excessive transmitter pre-emphasis / over-equalization | Tx FFE boost or Rx CTLE peaking set too high for a short PCB channel | Step down Tx de-emphasis preset or lower CTLE peaking gain until the dual rails merge. |
| 3. Mid-transition step ledges & notches | Impedance discontinuity & quarter-wave reflection (Sdd11) | Un-backdrilled through-hole via stubs, undersized anti-pads, or connector pads | TDR impedance profile per IPC-TM-650 2.5.5.7A. Backdrill stubs and size anti-pads to match target impedance. |
| 4A. Thick, cloudy rails (asynchronous noise) | Near-end crosstalk (NEXT) & power-supply ground bounce | Tightly coupled BGA breakout vias or shared return planes near Tx lanes | Disable adjacent aggressor transmitters to verify rail thinning. Add ground shadow vias around signal vias. |
| 4B. Thick rails with edge timing spread | Far-end crosstalk (FEXT) & bounded uncorrelated jitter (BUJ) | Insufficient pair-to-pair spacing along parallel microstrip or stripline runs | Measure VNA crosstalk coupling. Increase pair-to-pair guard spacing and route critical lanes in stripline. |
| 5. Asymmetrical / tilted eye crossing | Differential-to-common-mode conversion (Scd21) & DCD | Intra-pair P/N propagation delay mismatch or sparse 1080 glass fiber-weave skew | TDR delay skew and VNA Scd21 check. Match P/N propagation delay and use spread glass (1067/1078). |
| 6. Horizontal narrowing with clean rails | Random phase jitter (RJ) or sinusoidal periodic jitter (PJ) | Noisy reference clock PLL supply or switching regulator coupling | Jitter spectrum decomposition distinguishes RJ from PJ. Filter the clock supply rail to reduce phase noise. |
NRZ vs. PAM4 Eye Diagrams Across PCIe, Ethernet, USB, and DDR
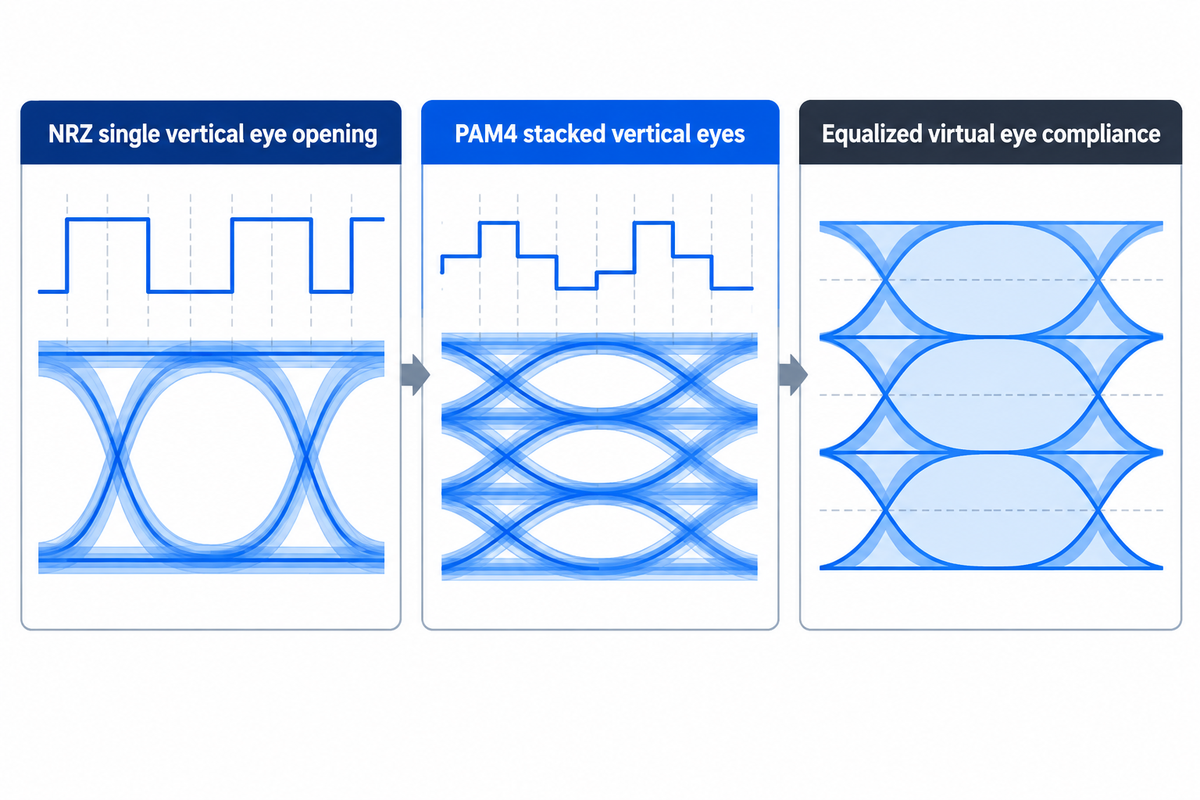
An NRZ eye diagram uses two voltage levels to transmit 1 bit per unit interval with a single eye opening. A PAM4 eye diagram uses four voltage levels to transmit 2 bits per unit interval. At equal total voltage swing and equally spaced levels, PAM4 stacks three vertical eyes and incurs a 9.54 dB vertical SNR penalty.
Packing two bits into each symbol cuts the Nyquist fundamental frequency in half compared to NRZ. PCIe 6.0 transmits at 64 GT/s using 32 GBaud PAM4 with a 16 GHz Nyquist frequency. PCIe 7.0 doubles the throughput to 128 GT/s using 64 GBaud PAM4 and a 32 GHz Nyquist frequency. However, dividing the same total transmitter voltage swing across three vertical eye openings reduces adjacent-level spacing to one-third (20 × log10(3) ≈ 9.54 dB SNR penalty). In PAM4 channels, ISI and unequal transition timing across the 12 directed transitions also affect the three horizontal eye openings. Signal Integrity Journal’s 128 GT/s PAM4 CEM channel tests found a roughly 33% loss in available horizontal eye size compared to NRZ, under similar conditions.
NRZ (2-Level Signaling)
- Transmits 1 bit per symbol across 2 voltage levels (0 and 1)
- Produces 1 vertical eye opening with 2 possible transition directions
- Full vertical voltage swing with baseline 0 dB SNR reference
- Used in PCIe Gen 1–5 (up to 32 GT/s), 10G/25G Ethernet, and USB4 Gen 2/3
PAM4 (4-Level Signaling)
- Transmits 2 bits per symbol across 4 voltage levels (00, 01, 10, 11)
- Stacks 3 vertical eye openings with 12 directed level transitions
- Incurs a 9.54 dB vertical SNR penalty at equal voltage swing
- Used in PCIe Gen 6/7 (64–128 GT/s) and 56G/106.25G/112G/224G Ethernet
To account for uneven compression of PAM4 eyes, strict requirements on Level Separation Mismatch Ratio (RLM) are defined in standards. Signal Integrity Journal’s PCIe 7.0 transmitter requirements specify a minimum SNDR of 34 dB, and uncorrelated total jitter of 2.0 ps peak-to-peak. The requirement also defines RLM to be 0.95, and filtered reference-clock phase jitter to be less than 67 femtoseconds RMS. In multi-gigabit links from PCIe 3.0 to PCIe 7.0, an unequalized physical eye at the receiver pin is permitted to look completely closed under the specification. Compliance is judged by the virtual eye after Reference Receiver Equalization (CTLE, FFE and DFE). In the higher frequencies of 16-32 GHz, high-frequency substrate loss becomes the primary constraint. We discuss high frequency physics in our high-frequency RF and microwave PCB design guide.
| Interface Standard | Modulation & Line Rate | Unit Interval & Nyquist | Vertical Eyes | Post-Equalization Compliance Target |
|---|---|---|---|---|
| PCIe 4.0 / 5.0 | NRZ, 16 GT/s / 32 GT/s | 62.5 ps (8 GHz) / 31.25 ps (16 GHz) | 1 eye | 10-12 BER after reference CTLE + DFE |
| PCIe 6.0 | PAM4, 64 GT/s (32 GBaud) | 31.25 ps (16 GHz) | 3 eyes | Pre-FEC FBER < 10-6 (10-12 post-FEC + CRC + FLIT retry) |
| PCIe 7.0 | PAM4, 128 GT/s (64 GBaud) | 15.625 ps (32 GHz) | 3 eyes | SNDR ≥ 34 dB, RLM ≥ 0.95, pad-to-pad loss ≈ -36 dB (SIJ) |
| 25G / 56G / 112G Ethernet | NRZ (25.78G) / PAM4 (53.125 GBaud) | 38.79 ps / 18.82 ps (26.56 GHz) | 1 eye / 3 eyes | IEEE 802.3ck Channel Operating Margin (COM) and reference Rx eye |
| USB4 Gen 2 / Gen 3 | NRZ (10 Gbps / 20 Gbps per lane) | 100 ps / 50 ps | 1 eye | TP3 equalized receiver eye mask compliance after CTLE + DFE |
When a Closed Eye Is Still Compliant: Pre-Emphasis, CTLE, and DFE
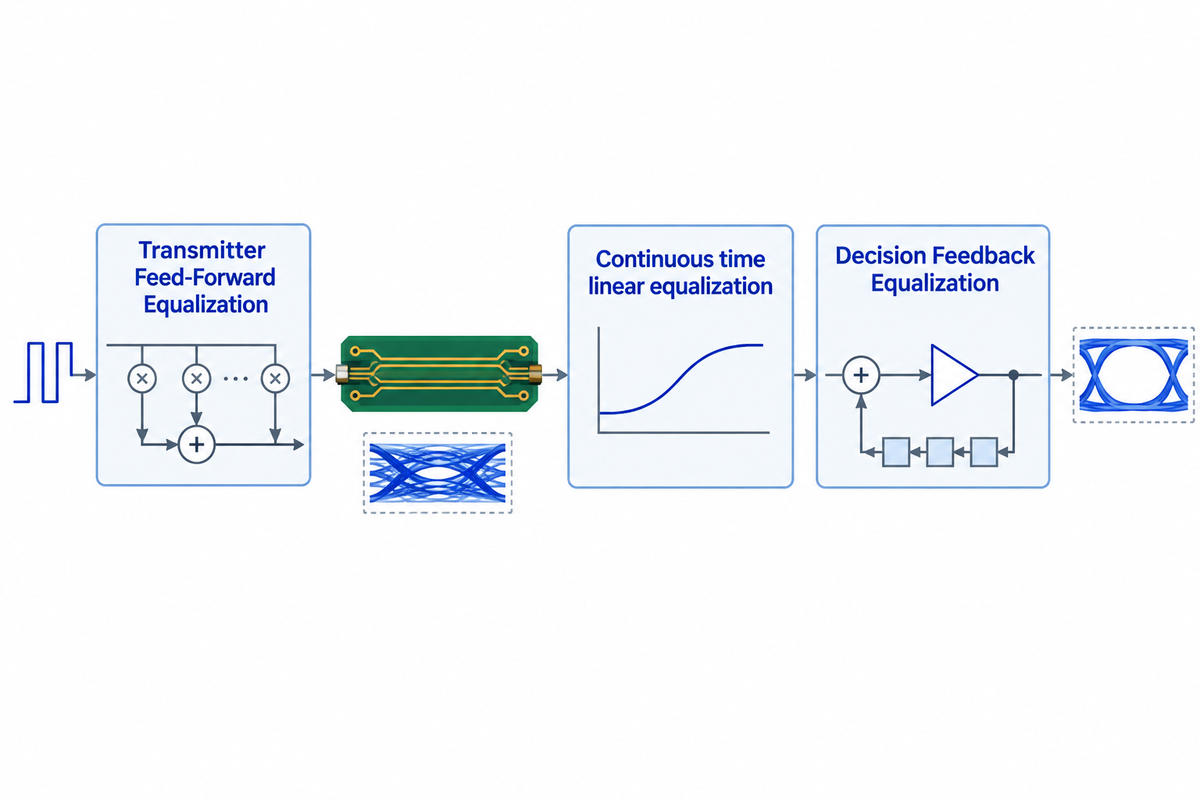
A high-speed signal eye often looks completely closed when probed directly at the receiver package pin (TP4). Passive PCB copper and dielectric losses cause severe inter-symbol interference (ISI) across the channel. The link still passes compliance because the transmitter FFE and on-die receiver CTLE and DFE filters refine the frequency response and cancel post-cursor ISI at the decision point.
Probing a multi-gigabit BGA ball with an oscilloscope without a reference receiver filter causes false failure readings. Most recent SerDes channel architectures partition equalization across three stages, as illustrated in IEEE 802.3ck 100G electrical channel reference receiver evaluations:
- The transmitter Feed-Forward Equalization (Tx FFE) stage uses a finite impulse response (FIR) filter at the transmitter to apply pre-shoot (pre-cursor tap) and de-emphasis (post-cursor tap) equalization. This pre-shoot attenuates low-frequency run amplitude, and allows high-frequency edges to arrive with equal amplitude after PCB loss.
- The receiver uses continuous time linear equalization (Rx CTLE) to boost high-frequency signal content and flatten the channel frequency response. Since CTLE is a linear process that reduces ISI, excessive peaking also amplifies high-frequency crosstalk.
- Decision Feedback Equalization (Rx DFE) uses a non-linear feedback loop based on previously sliced symbols to subtract post-cursor inter-symbol interference at the decision point without amplifying incoming noise. However, a large noise spike can cause a single symbol error that DFE tap feedback propagates into a burst error. That burst mechanism is why PCIe 6.0 and 7.0 specify First Bit Error Rate (FBER) and pair DFE with 3-way interleaved FEC, CRC detection, and link-level FLIT retry (PCI-SIG).
The core of any high-speed SerDes receiver is an equalizer. Physical probes can’t reach inside the silicon die after the Decision Feedback Equalizer (DFE) summer. Instead, tests performed in the lab use IBIS-AMI simulations or query on-die Eye Monitors. An example is the USPTO Patent US10845402B2, in which an on-die equalizer tap adjustment solution reconstructs the eye. Physical PCB stack-up structure reduces raw channel loss before the signal enters the receiver equalizer.
PCB Layout, Stackup, and Laminate Choices That Keep the Eye Open
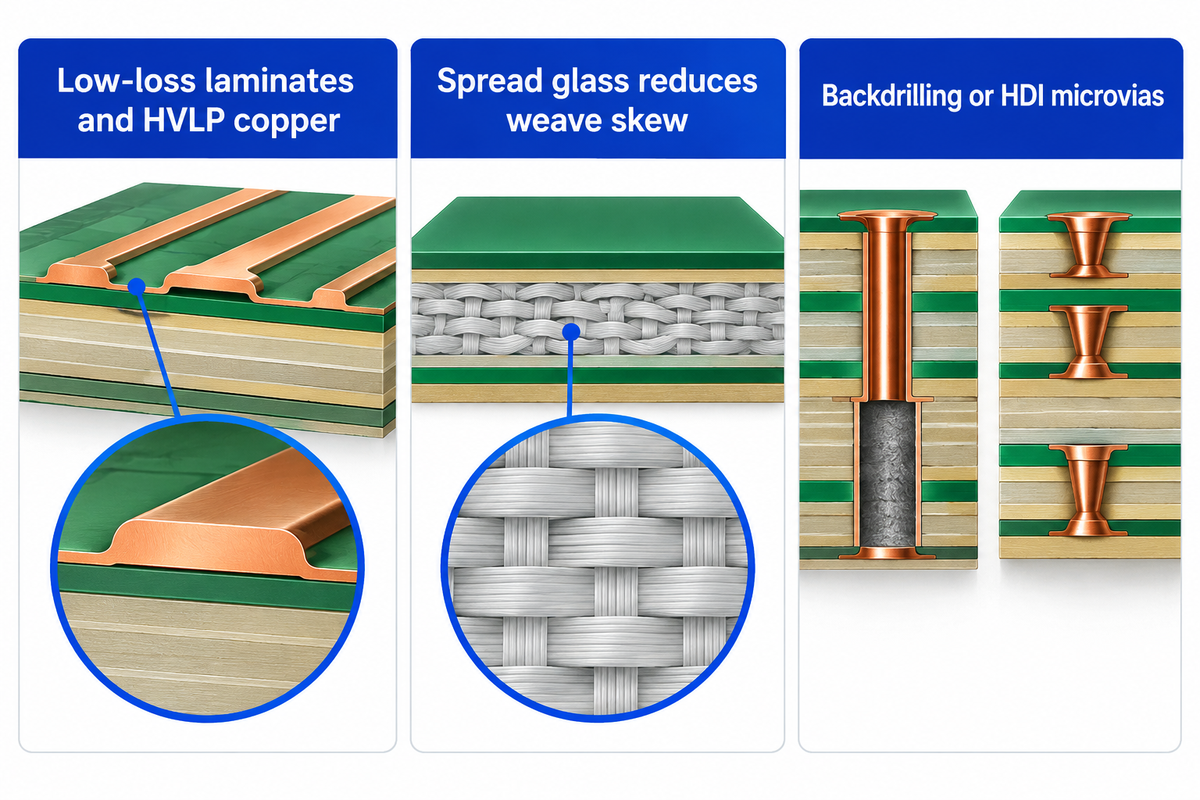
To keep a high-speed PCB eye open, one needs to consider the laminate dissipation factor (Df), copper foil roughness, glass-fabric weave style, and via-stub length, among other factors, in relation to the expected Nyquist frequency. Use of low-loss laminates and high-volume low-pressure (HVLP) copper reduces attenuation. Additionally, spread glass reduces weave-induced skew and back-drilling or HDI microvias reduce via-stub reflections.
Equalization can account for smooth frequency dependent dielectric loss. Deep quarter-wave via-stubs limit the recovery, and glass-weave skew introduces unequal propagation delays that shrink the differential eye opening. For 128 GT/s PAM4 links, Signal Integrity Journal’s PCIe 7.0 routing constraints cap total pad-to-pad channel loss at 32 GHz at approximately -36 dB. That budget sets a baseline where PCB traces must exhibit less than 1.0 dB of insertion loss per inch (2.5 cm) at Nyquist. For other serial standards, dividing the trace-loss allocation in dB by the routed trace length gives the allowable average trace loss per unit length. Simultaneously, IEEE Xplore research on high-speed via-stub resonance confirms that trimming unused through-hole barrels via controlled-depth backdrilling pushes resonant notches above the signaling band.
Laminate dielectric constant, dissipation factor, and copper-foil roughness all vary with glass-weave, pressed resin content, and test frequency. Final stackup release must use the pressed prepreg impedance and loss calculation of the fabricator. Engineers scaling up from complex 16-24 layer PCB lamination and blind/buried vias to 32-42 layer PCB stackups and signal integrity must finalize their material selection early. Rogers and low-loss high-speed PCB manufacturing integrate well with HDI microvia PCB fabrication, thus eliminating resonant through-hole stubs on dense SERDES breakouts.
High-Speed PCB Laminate and Via-Stub Budget Matrix
This nine-row synthesis matrix relates data-rate tiers, serial protocols, laminate Df tiers, roughness profiles of copper, weave styles of fiberglass, and architectures of via-stub control.
| Data Rate Tier | Representative Protocols | Laminate Loss Tier & Representative Material | Copper Foil Profile | Glass Weave Style | Via Stub Architecture & Impedance Tol. |
|---|---|---|---|---|---|
| ≤ 2.5 Gbps NRZ | PCIe 1.0 (2.5 GT/s), GbE, LVDS | Standard FR-4 (Isola 370HR / Shengyi S1141) | Standard electrodeposited (ED) copper | Standard 2116 / 7628 weave | Standard through-hole via; standard tolerance |
| 5–8 Gbps NRZ | PCIe 2.0 (5 GT/s), SATA 3, USB 3.0 | High-Tg FR-4 (Shengyi S1000-2 / TUC Tu-862) | Standard ED or Reverse Treated Foil (RTF) | 2116 / 3313 balanced weave | Minimize stub via layer transition; controlled TDR |
| 8–10.3 Gbps NRZ | PCIe 3.0 (8 GT/s), 10GBASE-KR, USB4 Gen 2 | Mid-Loss laminate (Isola FR408HR / Megtron 2) | RTF or Very Low Profile (VLP) foil | 1078 / 3313 flat weave | Backdrill thick backplanes or route on far layers |
| 16 GT/s NRZ | PCIe 4.0 (16 GT/s), USB4 Gen 3 (20 Gbps) | Low-Loss laminate (Panasonic Megtron 4 / Tachyon) | VLP copper foil on high-speed layers | Spread glass 1067 / 1078 | Backdrill long stubs or use blind/buried vias; ±5% (Sierra) |
| 25–28 Gbps NRZ | 25G/100G Ethernet (NRZ), CEI-28G | Very-Low-Loss laminate (Panasonic Megtron 6) | Hyper Very Low Profile (HVLP) copper foil | Spread glass 1067 / 1078 | Controlled-depth backdrill or HDI microvia; ±5% |
| 32 GT/s NRZ | PCIe 5.0 (32 GT/s, 16 GHz Nyquist) | Very-Low-Loss laminate (Megtron 6 / Isola I-Tera) | HVLP / HVLP2 low-roughness copper | Spread Low-Dk glass (NE-glass) | Controlled-depth backdrill or HDI microvia; ±5% |
| 56–64 GT/s PAM4 | PCIe 6.0 (32 GBaud, 16 GHz), 56G Ethernet | Ultra-Low-Loss laminate (Megtron 7 / Rogers RO4000) | HVLP2 / HVLP3 smooth copper foil | Spread NE-glass + dual-ply prepreg | Tight backdrill stub control or HDI microvia; ±5% |
| 106.25–128 Gbps PAM4 | IEEE 802.3ck (53.125 GBaud), PCIe 7.0 (64 GBaud) | Extreme-Low-Loss laminate (Megtron 8 / Tachyon 100G) | HVLP3 / HVLP4 ultra-smooth copper | Ultra-low-Dk quartz / NE spread glass | HDI microvia; PCIe 7.0 trace loss < 1.0 dB/in at 32 GHz (SIJ); ±5% |
| 224 Gbps PAM4 | 800G / 1.6T Ethernet (106–112 GBaud) | PTFE / Hybrid Hydrocarbon substrate | HVLP4 ultra-smooth copper foil | Homogeneous PTFE or Q-glass | Zero-stub HDI microvia or twinax flyover; ±5% |
How to Set Up an Oscilloscope and Clock Recovery for Eye Diagram Analysis
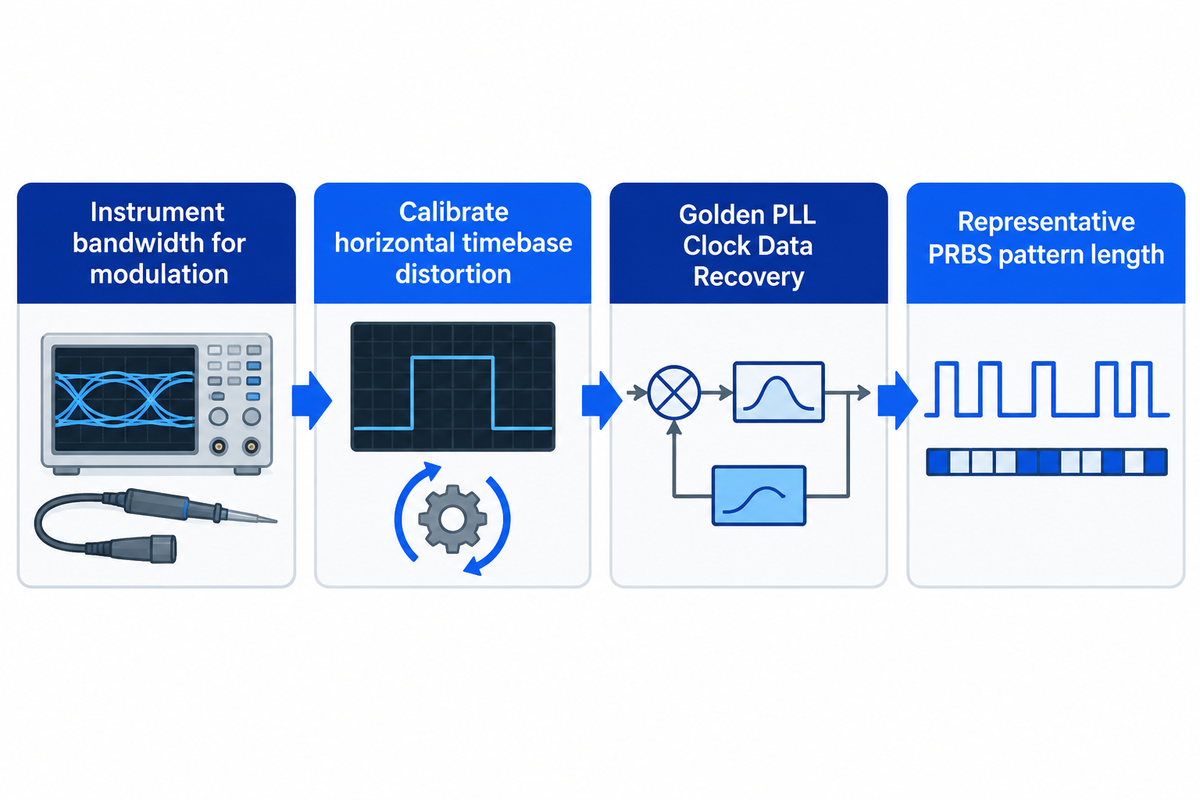
Analyzing an eye diagram across serial protocols requires an understanding of the harmonic structure of your signal and an oscilloscope and probe bandwidth matched to that structure, as well as a Golden PLL clock recovery filter matched to the bandwidth of the protocol loop, and de-embedded S-parameters for all test fixtures and cables.
A misconfigured lab equipment setup can make a compliant PCB appear to have defects or hide real jitter. Before condemning your board, verify the following five steps:
- Select proper instrument bandwidth based on your modulation format. A sampling oscilloscope, as described in the Sierra Circuits oscilloscope setup guide, requires a bandwidth of 1.5 to 2 times the signal frequency. For PAM4 links, Signal Integrity Journal’s PCIe 7.0 measurement guidelines mention that for PCIe 6.0, a 50 GHz minimum real-time oscilloscope bandwidth is required. PCIe 7.0 (128 GT/s) increases the minimum real-time scope bandwidth to 65 GHz to capture second-harmonic energy at 64 GHz.
- Account for oscilloscope timebase distortion and intrinsic noise floor. NIST research on oscilloscope timebase distortion and measurement uncertainty shows that the eye jitter displayed on an oscilloscope is the RSS of channel impairments and noise intrinsic to the measurement instrumentation. Always calibrate and correct the horizontal timebase distortion. The vertical signal can be scaled to fill the ADC dynamic range.
- Configure the Golden PLL Clock Data Recovery (CDR) to the exact protocol specification (for example fbaud/1667 or PCIe’s specified phase-locked loop order). A CDR loop bandwidth set too wide will track low-frequency periodic jitter and artificially increase eye width.
- Choose a PRBS length that’s representative of the type of jitter that you would like to stress. Short patterns like PRBS7 (2 7 – 1 = 127 bits) stress rapid edge transitions. Long patterns like PRBS31 (2 31 – 1 bits) expose long-run baseline wander and deep inter-symbol interference.
- Use the on-die Lane Margining Receiver (LMR) for field-deployed systems. The Signal Integrity Journal notes that PCIe links running at 16 GT/s and above in the L0 state can support built-in LMR. Software can sweep timing and voltage margins (if supported) on deployed systems.
What to Specify to Your PCB Manufacturer to Lock In Eye Diagram Margin
To manage process variations versus what is simulated in an eye diagram, authorize the pressed stackup table prior to layout release. Define exact laminate slash sheets, controlled-impedance tolerances, backdrilled via-stub limits, IPC-TM-650 2.5.5.7A TDR coupons, HVLP copper roughness limits, and IPC-TM-650 2.5.5.12A insertion loss.
Writing “FR-4 or equivalent, 100 ohm differential” on a fabrication drawing invites unannounced material substitutions that erode eye height in production. IPC-6012 Class 2 or Class 3 defines board acceptance criteria. Advanced fabrication lines also support fine trace/space down to 2 mil (0.002 in), ±5% controlled-impedance tolerances, and 24-hour prototype turnaround (Sierra Circuits). Fabricators verify trace impedance on dedicated panel TDR coupons per IPC-TM-650 Method 2.5.5.7A before shipping boards. Panel-edge controlled-impedance and insertion-loss coupons (TDR and SET2DIL coupons) verify batch trace geometry and dielectric consistency. System-level eye margin still depends on connector transitions, package parasitics, and transceiver equalizer tap weights.
Do
- Approve the fabricator’s pressed stackup table with exact laminate brand, prepreg resin content, and Dk/Df at your Nyquist frequency
- Specify controlled-impedance tolerances from your channel budget (such as ±5% on critical high-speed differential pairs)
- Call out maximum remaining via stub length after controlled-depth backdrilling (not drilling depth)
- Require TDR impedance reports (IPC-TM-650 2.5.5.7A) and SET2DIL / SPP loss coupon data (IPC-TM-650 2.5.5.12A) with every lot
Don’t
- Do not allow generic “FR-4 equivalent” substitutions on multi-gigabit serial links
- Do not leave non-functional inner-layer pads on high-speed through-hole signal vias
- Do not route high-speed differential pairs over sparse 1080 glass without spread-weave callouts
- Do not skip pre-layout stackup confirmation with your PCB manufacturer’s CAM engineering team
| Fabrication Drawing Item | Recommended Engineering Spec | Factory Inspection Method | Eye Diagram Risk if Omitted |
|---|---|---|---|
| 1. Pressed Stackup Approval | Exact laminate slash sheet (Megtron 6/7/8, Rogers) & pressed dielectric thickness | Pre-build CAM stackup sign-off + microsection | Unapproved prepreg substitution shifts Dk/Df and increases ISI |
| 2. Controlled Impedance Tolerance | Set per channel budget (down to ±5% on critical diff pairs per Sierra Circuits) | Panel TDR coupon per IPC-TM-650 2.5.5.7A | Return-loss reflections create step ledges that shrink vertical eye height |
| 3. Copper Foil Roughness | VLP or HVLP low-profile copper foil on high-speed signal layers | Foil lot certification & insertion-loss coupon | Skin-effect conductor loss attenuates fast transition edges |
| 4. Via Backdrill Stub Limit | Specify maximum remaining stub length Lstub per Nyquist band | X-ray depth verification & cross-section audit | Quarter-wave stub resonance notches collapse eye opening |
| 5. Spread Fiberglass Weave | 1067, 1078, or 3313 spread glass; prohibit sparse 1080 weave | Stackup BOM audit + differential skew coupon | Intra-pair propagation delay skew tilts eye crossing |
| 6. Batch Insertion-Loss Coupon | Coupon insertion loss at Nyquist (e.g., < 1.0 dB/in at 32 GHz for PCIe 7.0 per SIJ) | SET2DIL (Method D) or SPP VNA (Method E) per IPC-TM-650 2.5.5.12A | Etching and resin variation can increase PCB loss and consume channel margin |
Key takeaway
An open high-speed PCB eye requires voltage and timing margin at the receiver latch. Reflections, loss, skew, noise, jitter, and equalization govern that margin, while ±5% TDR coupons and SET2DIL loss coupons lock in production consistency.
Every production panel we fabricate undergoes cross-section validation, AOI and TDR controlled-impedance testing and PCB inspection.
Frequently Asked Questions
What is the difference between eye height and eye width in an eye diagram?
Eye height is measured in millivolts (mV), and eye width is measured in picoseconds (ps) or Unit Intervals (UI). Eye height is the voltage noise margin between inner noise boundaries of logic 1 and logic 0 rails. It represents the margin against channel attenuation, inter-symbol interference and crosstalk. Eye width measures the timing margin against random and deterministic jitter. Eye width is measured between zero-crossings of the signals.
Why can a high-speed PCB signal have a closed eye diagram at the receiver pin and still work?
Modern SerDes links still work with a closed raw eye at the receiver pin (TP4), as on-die CTLE and DFE equalizers reopen the eye before the latch. In standards from PCIe 3.0 through PCIe 7.0, dielectric and copper skin effect losses often close the unequalized passive eye completely. Continuous-Time Linear Equalization (CTLE) reshapes the channel frequency response, and Decision Feedback Equalization (DFE) cancels post-cursor inter-symbol interference at the decision point. Compliance is evaluated on the virtual eye after equalization.
How does a PAM4 eye diagram differ from an NRZ eye diagram?
An NRZ signal uses two voltage levels (0 and 1) to produce a single eye opening, while a PAM4 signal uses four voltage levels (00, 01, 10, 11) to stack three vertical eyes per Unit Interval. NRZ transmits one bit per symbol across two transition directions, while PAM4 transmits two bits per symbol across 12 directed transition types and reduces adjacent level voltage spacing to one-third (-9.54 dB SNR penalty) at equal total swing.
What causes double lines or split rails on an eye diagram?
Isolated single-bit transitions in the presence of ISI reach a lower voltage compared to consecutive identical bits, and may produce double lines or split horizontal rails on an eye diagram. Uncompensated via stubs, connector pads, or excessive pre-emphasis may also split the horizontal voltage rails on an eye diagram.
How do PCB via stubs affect an eye diagram, and when is backdrilling required?
Unused via stubs reflect high frequency energy and create resonant notches which collapse the eye. Backdrilling is necessary when via reflections exceed the channel budget. Engineers can also route differential pairs on the bottom layers, use blind and buried HDI microvias, or use active backside routing. In production, controlled depth backdrilling removes the unused copper barrel to shorten the remaining stub and push its resonance above Nyquist.
What oscilloscope bandwidth do you need to measure an eye diagram?
To capture the fifth harmonic of NRZ Nyquist, set a real-time oscilloscope with a bandwidth of at least 2.5 times the NRZ bit rate. Sampling oscilloscopes require 1.5-2 times signal frequency, and PCIe 6.0 and 7.0 PAM4 mandate 50 GHz and 65 GHz real time scopes, respectively.
Lock In Your High-Speed PCB Eye Margin Before Fabrication
Routing multi-gigabit designs on Megtron, Rogers, and hybrids? Our signal-integrity CAM engineers can help. Send us your Gerbers and stackup requirements. You can request a high-speed PCB DFM and stackup review for a ±5% TDR impedance and backdrill verification.
References & Sources
- An Introduction to Eye Diagrams, Part 1 In Compliance Magazine
- PCIe 7.0 at 128 GT/s PAM4 Validation in Real CEM Channels Signal Integrity Journal
- Engineering Statistics Handbook: Normal Distribution and Tail Probability Functions National Institute of Standards and Technology (NIST)
- Statistical Eye Diagram Modeling for High-Speed Serial Interconnects MDPI Electronics
- PCIe 6.0 Specification: Error Detection and Correction (FEC) and FLIT Reliability PCI-SIG
- IEEE 802.3ck 100G/Lane Electrical Channel and Reference Receiver Equalization Institute of Electrical and Electronics Engineers (IEEE)
- High-Speed PCB Via Stub Resonance and Backdrilling Signal Integrity Analysis IEEE Xplore
- Uncertainty in Oscilloscope Timebase Distortion Estimates National Institute of Standards and Technology (NIST)
- US10845402B2: On-Die Eye Diagram Monitor and Receiver Equalization Calibration United States Patent and Trademark Office (USPTO)